EUR/USD is the most traded pair. Prices were in a range since 2015. But now, the market is trending up. So let's make a long-term technical Analysis.
Bullish Breakout: you are certainly aware of this breakout and that is why we will try to have a deep look into the actual market's behavior.
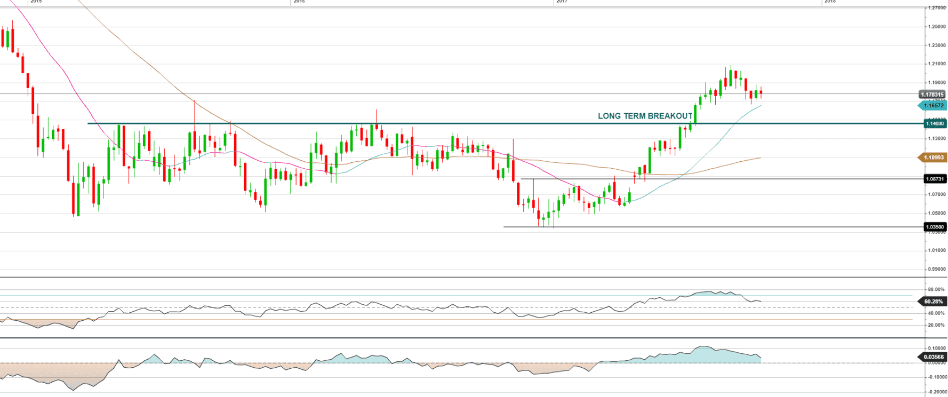
As you can see, the market's conviction was really strong as prices continued to go up even 2 months after the breakout. For the moment, the pair didn't come back to its breakout level but a pullback could happen as prices started to go down after flirting with the 1.21 level.
Elliott's waves : when considering the big picture of this chart, we would say that the market is actually in its second wave cycle. You can see that between the end of 2016 and April, prices went up but it was more a range than a trend. Therefore, we can't really consider this movement as being any wave cycle. So let's have a look at the chart below to illustrate how we see the actual market cycles. (Please note that the weekly chart represent the medium term cycles and the daily chart represents the short term cycles so you can see 5 short term waves inside the first medium term Elliott's wave)
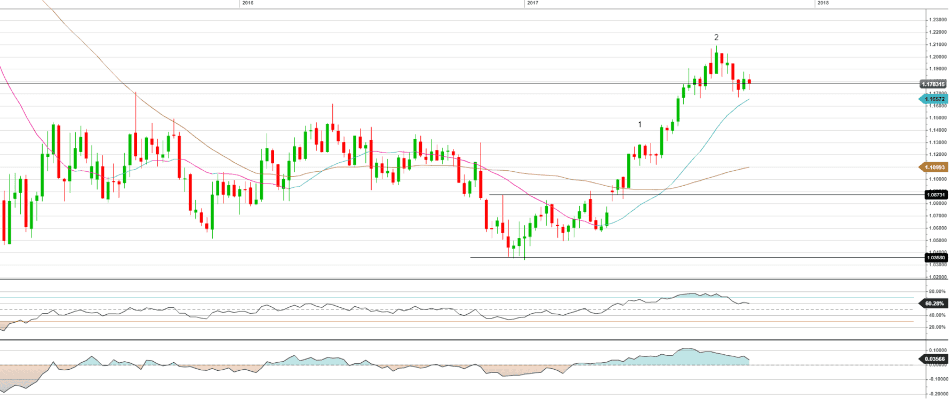
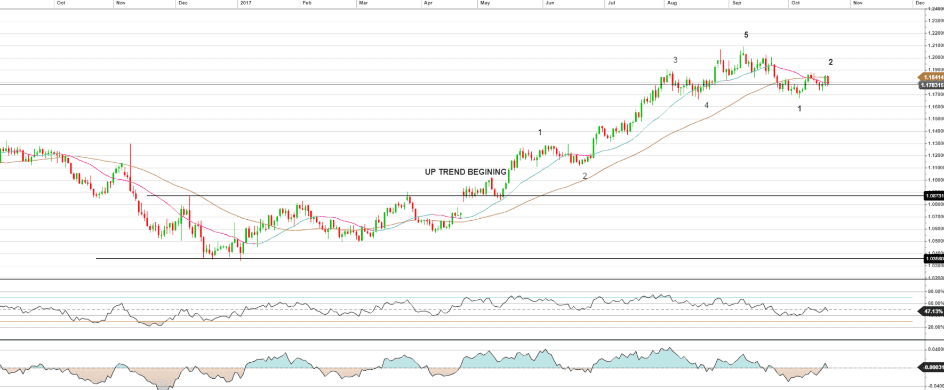
Please note that the weekly chart (chart above) represents the medium term cycles and the daily chart (chart below) represents the short term cycles so you can see 5 short term waves inside the first medium term Elliott's wave
So, if the market begins its second wave, the question would be : when will this wave end ? The answer is very simple. The only thing to do is to use the Fibonacci retracements.
We can clearly see that their is a confluence of technical levels. The first one is the support between 1.1445 and 1.1484. The second one is the 38.2% retracement and as you can see, these tow levels are very cloth. Having several technical levels at the same price level is a real advantage because market will have more difficulties to breakout.
If you observed the daily chart, you might be able to detect the head and shoulders pattern which is a reversal pattern.
The conclusion would be to wait for a retracement and buy the market when a pullback is made and at least the 38.2% of the Fibonacci retracements are reached. Try to open your trade at the end of the last wave or at the beginning of the first one.