Why you should short APPL now
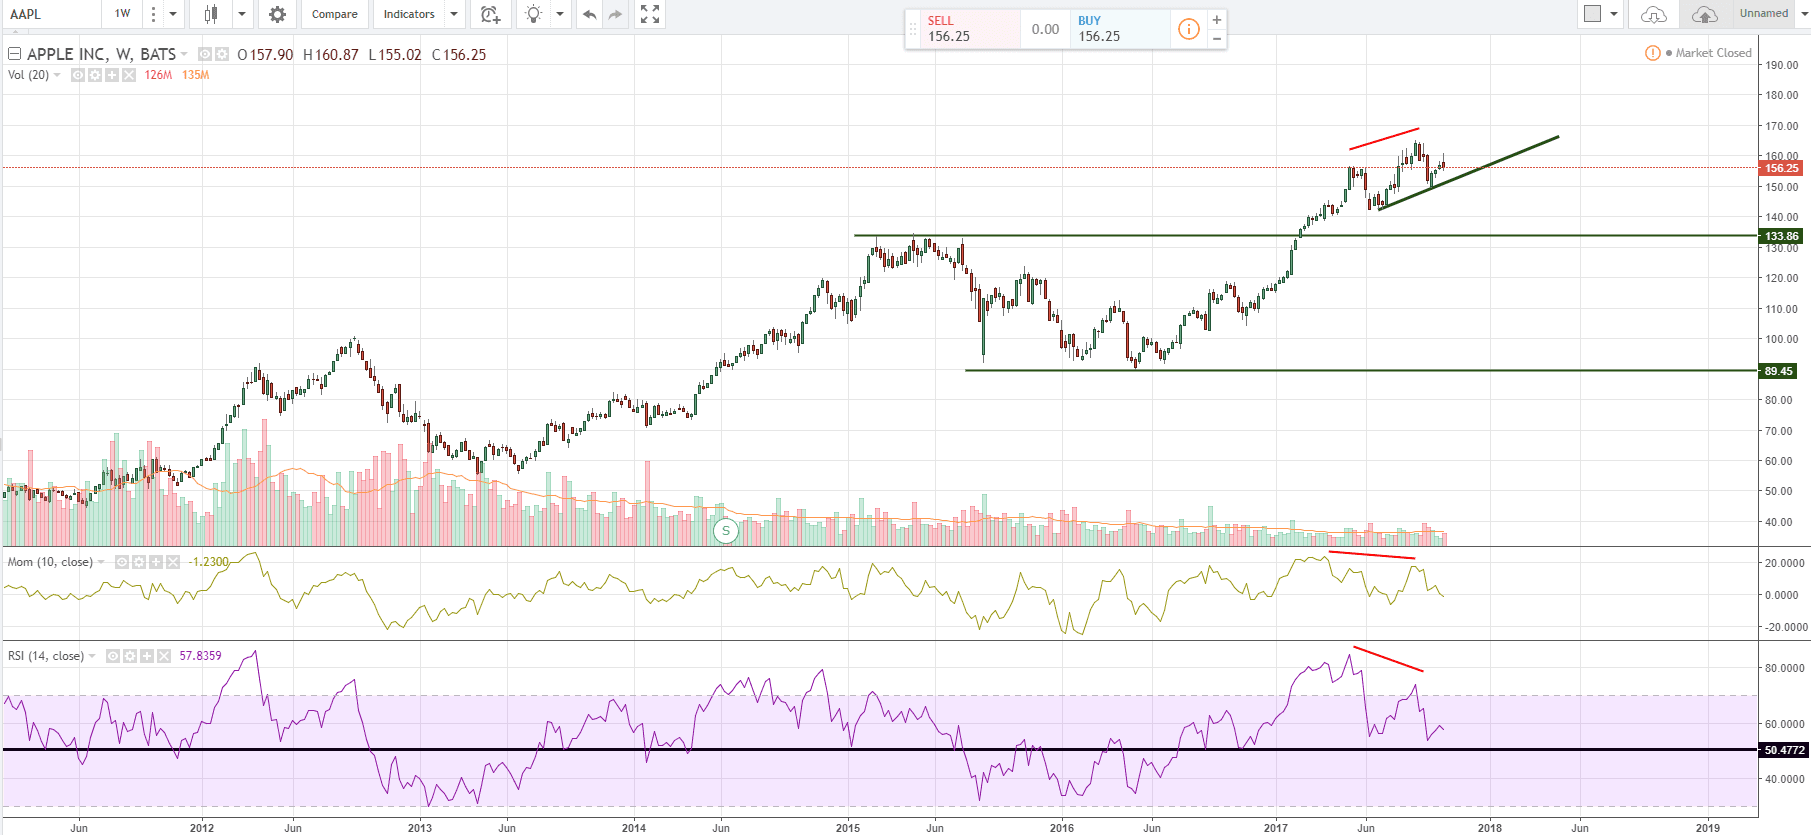
As you can see on the chart, their is two technical indicators : the RSI and the Momentum. Momentum is great because unlike the RSI, values are not ganging from 0 to 100. So, a divergence on the Momentum will be more important and more likely to impact our trading decisions than a divergence on the RSI.
Concerning the chart above, the weekly chart of APPL, buyers are showing weakness signs and it could be the beginning of a big drop. The momentum indicator already crossed the 0 level and if the RSI cross below the 50%, then the downtrend will be confirmed. Please note how strong is the 50% level and its ability to define the trend type. Also, we have to focus on the support line (the oblique one) and the strategy would be to enter short on the breakout.
Also, volumes are decreasing dramatically and it just confirm that investors are starting to be less and less interested by the stock.
The chart below is showing the Elliot waves and it just confirm what we said before : this stock must be shorted ! The market just completed the full trend cycle. It seems that it already made the first and the second wave so you shouldn't for going short and catch the bigger wave : the third one.
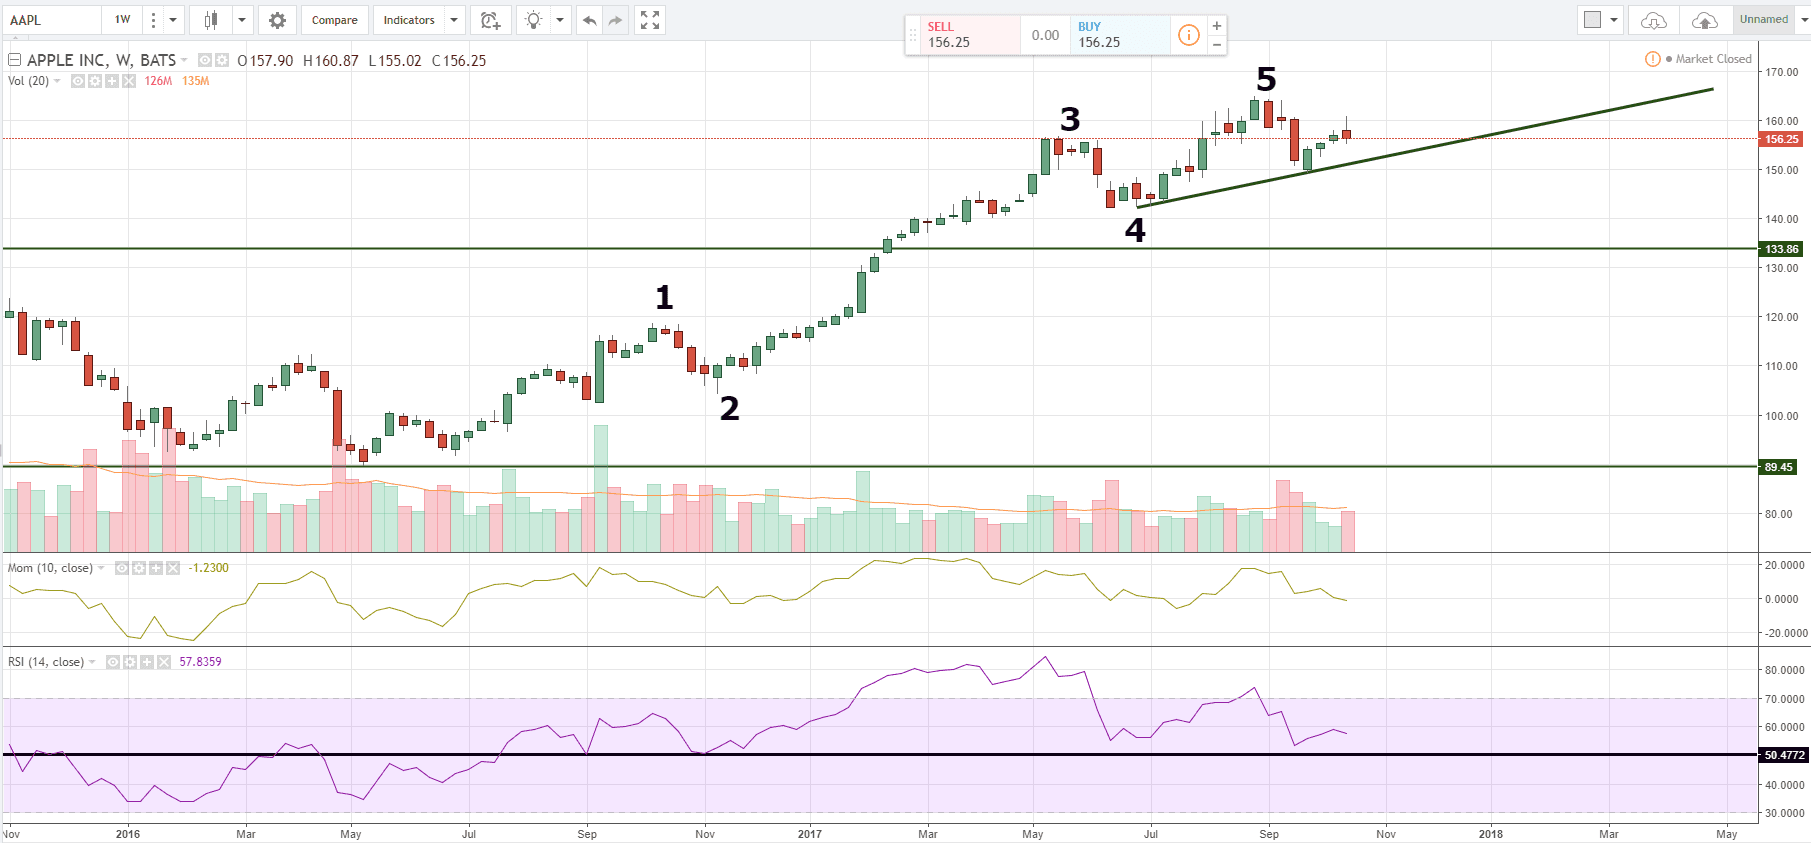
The final strategy is definitely to go short on the support's breakout ans to continue shorting on the fifth wave. A good thing to do would be to have a look at the NASDAQ and to short it if you have any technical opportunities. After all, AAPL weighs 11.55% of the NASDAQ.