CRUDE OIL - LONG TERM FORECAST & STRATEGY
Will the Oil recover from its huge 2014 drop ? This technical analysis will help you to answer to this question and to establish a trading strategy
For this long term forecast, we will study the monthly chart and the COT report. (You can always download charts to see them better)
The Crude Oil didn't fully recovered from the 2014 drop but only recovered 37%. So what about market's technical aspects ? Well we should have a look at the chart below :
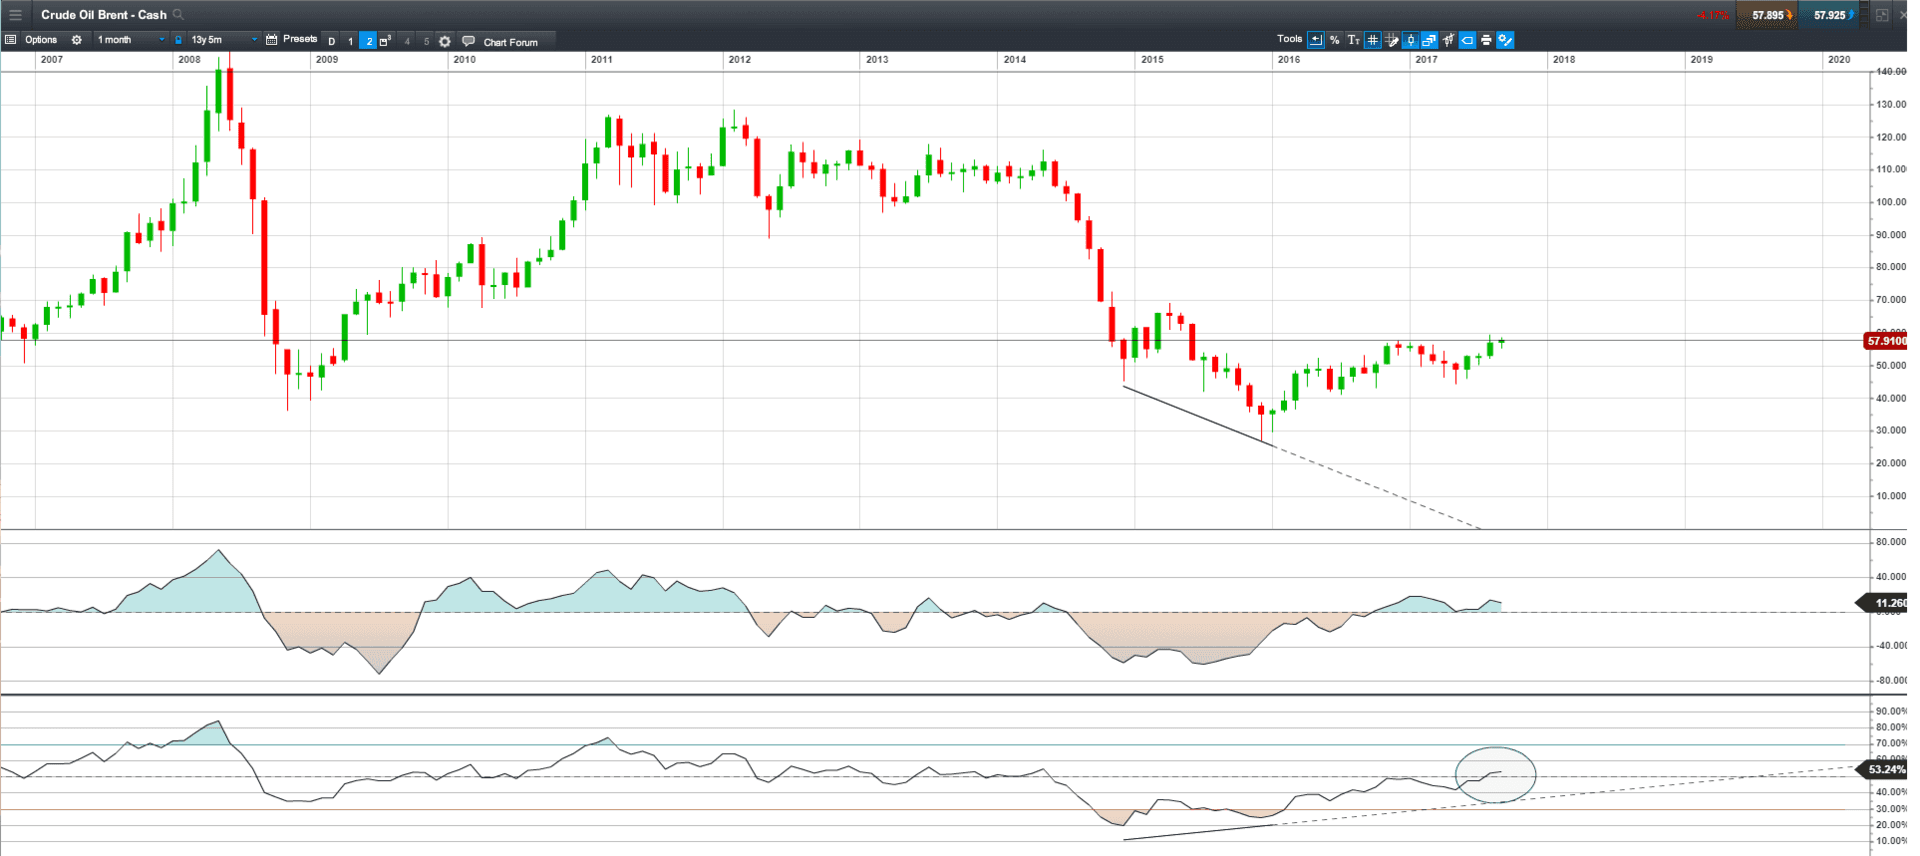
This monthly chart is very clear and when looking at technical indicators such as the RSI and the Momentum, we can more easily determine what the market is doing and therefore, make a pertinent future price estimation.
As you can see, there is a divergence with the RSI and the market's price. RSI was going up while price were making new lows. It is the same with momentum that staid at the same level while the market was falling. But, these divergences were not confirmed so it wasn't possible to use them to trade. Now, the RSI is above the 50% level and the momentum indicator is above 0. Technical indicators are showing an up trend and it just confirm the divergence. The divergence was telling us that buyers were becoming stronger than sellers but sellers were still stronger than buyers. Now, it seems that bulls are controlling the market.
Because we are good traders and we need a good timing, the next chart will show us market's cycles which will help us to open a trade at the perfect moment.
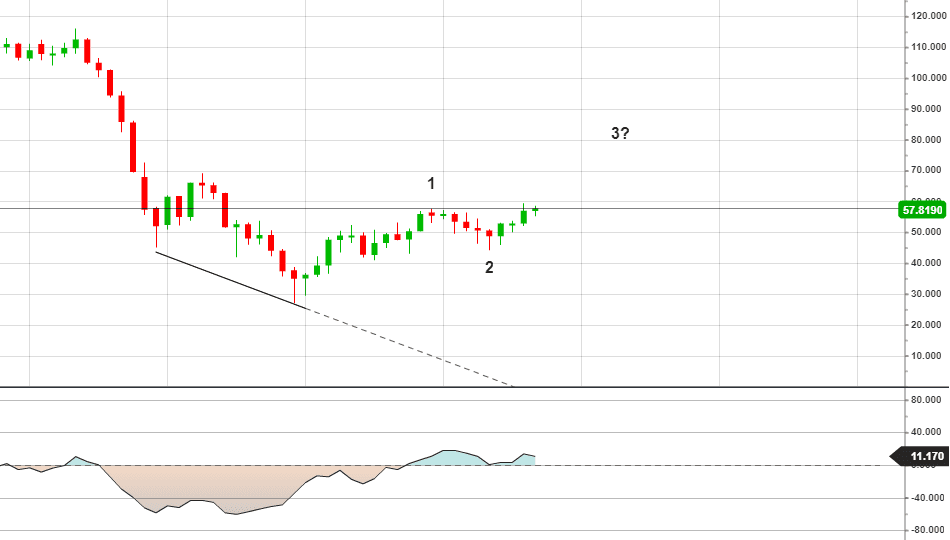
The wave 3 has begun. But when looking at the momentum indicator, we can see a little divergence but once again, we can't consider it for shorting the market, but it tells us to wait for another confirmation. When market will have make a clear breakout above the first Elliott wave, then we will be able to take a long. The optimal level would be to enter on the first pullback.
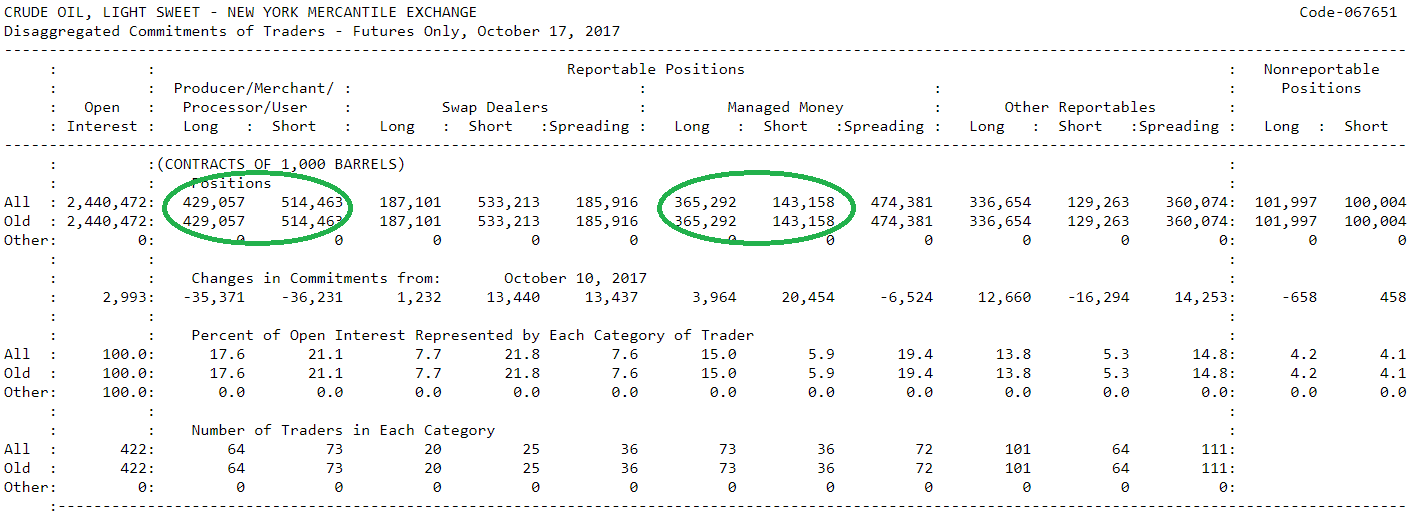
The COT (Commitment of Traders) shows us how the market's participants are positioned on the market. Producers are always in the wrong side of the market (it is because when the market goes up, it is a good opportunity for them to sell at higher prices and when market is going down to buy at a lower price. So they buy when the market goes down and they sell when the market goes up.)
So oil producers are actually buying oil, this a cycle. Big traders ("Managed Money" category) is long on this market.
Finally, bulls are actually more powerful than bears and that is why it would be nice to be long on crude oil.