CAC 40 - Will market continue its rally ?
When analysing a chart, it is important to have the big picture in mind, therefore to scale it for a long term timeframe.
The chart below is the CAC40 represented in a monthly time frame. At the very beginning of the chart you can see the market crashing during the 2008 crisis. This is an important data because it provides the highest CAC40's price before the recession.
Now, comparing the actual price to this high, we can see that market didn't fully recover from 2008 which means that the index is not driven by a fantastic enthousiasm as this is the case with US indexes.
You probably noticed the divergance between the index and the RSI indicator which is giving us a hint about a market's weakness. But, the divergance would only be confirmed if RSI crosses down the 50% level.
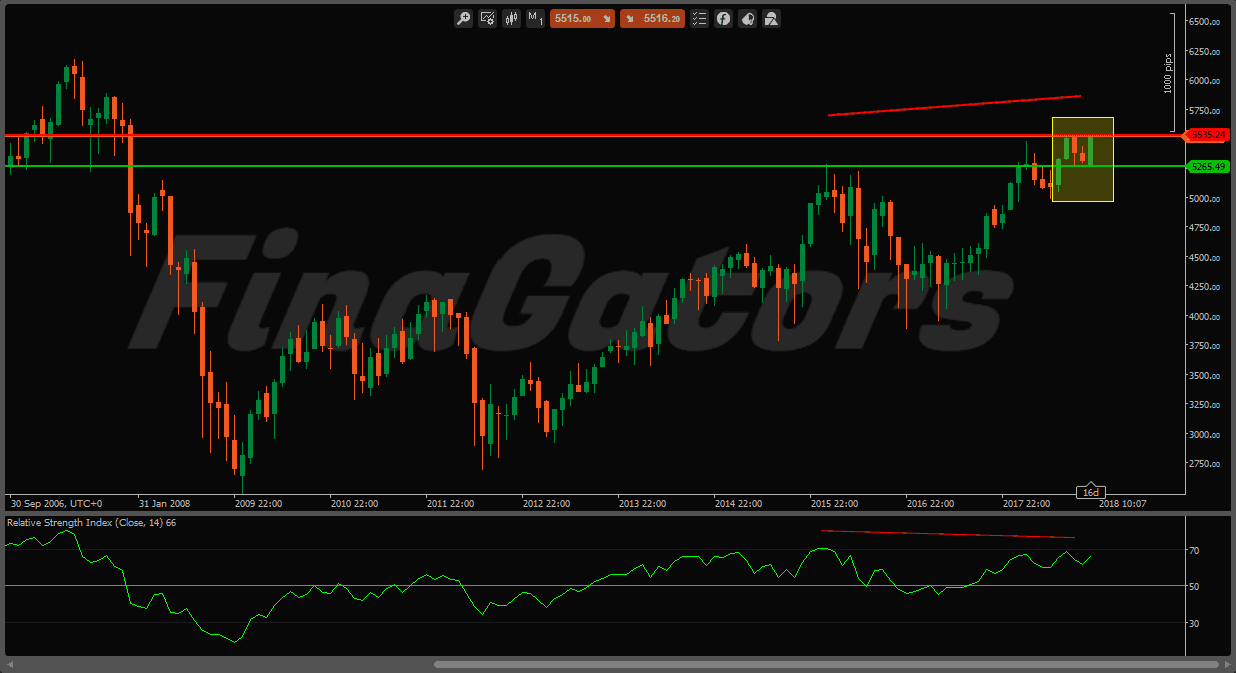
Now let's have a look at the daily chart. The daily chart will show us the short term market's strenght, inside the yellow box of the above monthly chart.
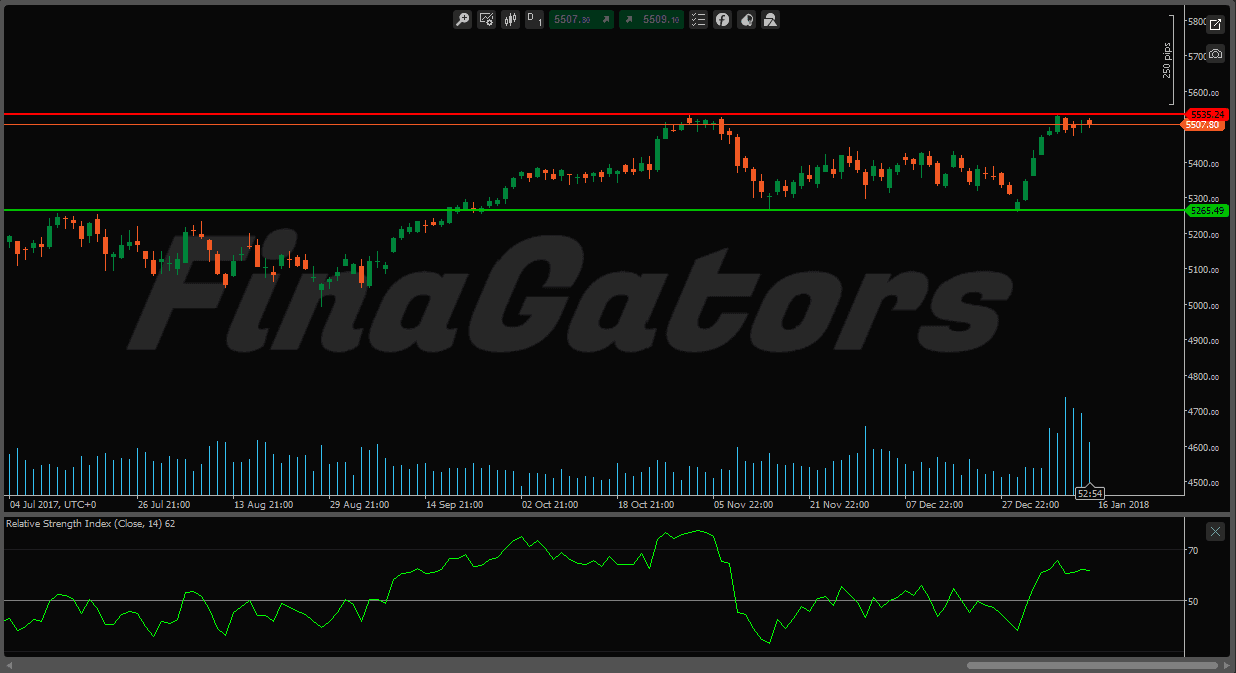
5535 is a resistance that could be broken, leading to the continuation of the bullish market. Note the pic of volume that takes place in the previous days which gives us a powerfull information: participants are actively participating and intersted in these levels. But, the RSI is diverging from the market's price meaning that momentum is as strong.
Conclusion:
while the actual long term trend is up, the strategy would be to wait for the market to break out the resistance. The french index could also cross down the 5265 support which could mean the beginning of a bearish market.